- Another look at the definitions
“An old shape but a more and more precise representation”
We can speak of the old shape because the shape of the Saire Valley was already being drawn on maps since the 17th century. However, these are not the same details that appear since they are subject to the author’s objective and the map’s finished result. Thus:
- An ancient topographical map = knowledge of the territory, the places of worship, a sort of religious mapping of the territory.
- Maritime chart = navigating safely, getting from A to B.
The representation is more and more precise as the survey techniques on the ground improve. The work of Cassini, who used a triangulation technique, is particularly well known. Under Napoleon 1, new surveys were carried out between 1827 and 1866. It is difficult, however, to quantify the margin of error.
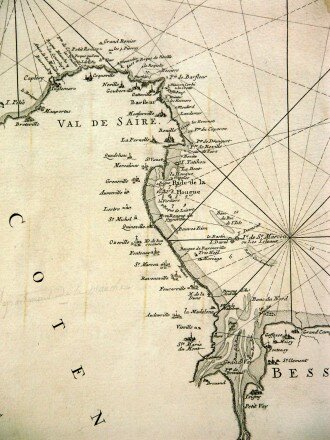
Extract from the map of Neptune La Hougue – 1700 Private collection J.P. Peltier)
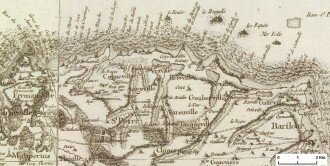
Extract from Cassini’s map – 1756 to 1789 (Sources : Géoportail)
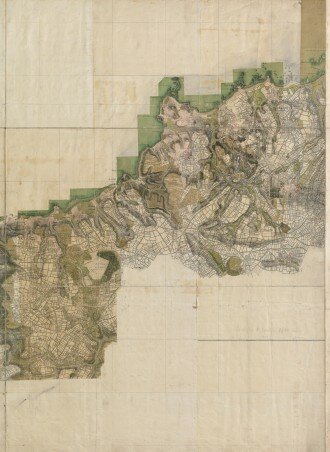
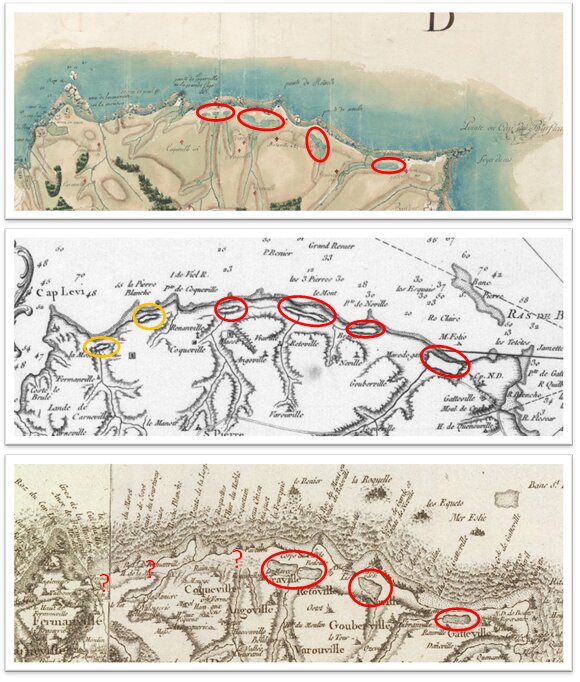
Extract from the Vauban map – Area to the west of the Saire Valley site – 1774-1778 (Sources : SHD)
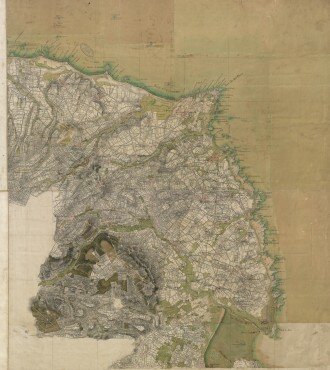
Extract from the Vauban map – Area to the east of the Saire Valley site – 1774-1778 (Sources : SHD)
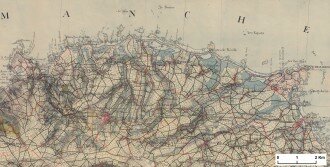
Extract from the Etat-major map – 1827 (Sources : Géoportail)
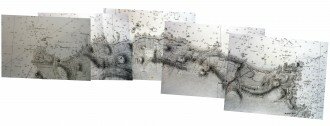
Extract from the Beautemps-Beaupré map (collection) – 1836 Edition (Sources : BNF)
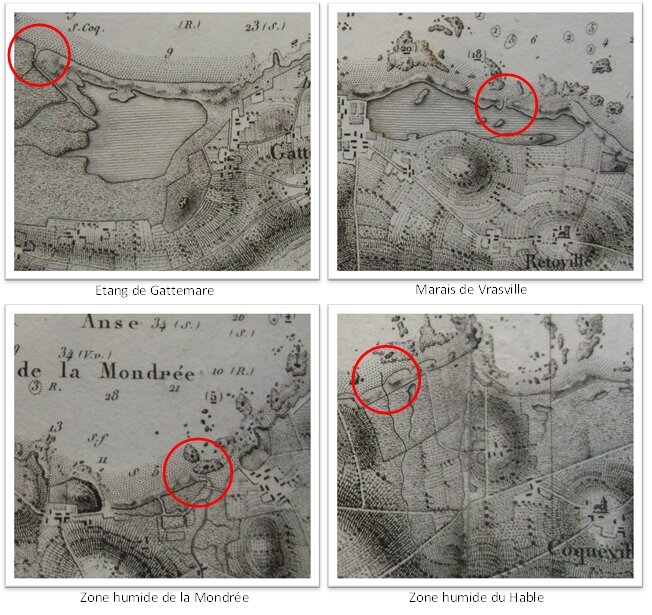
- Flooding of the marshes
When we compare the old maps and notably if we focus on marshes set back from the coast, we see that these are not always apparent. It is likely that periodic flooding of these wetlands is the explanation, considering that in summer, most bodies of water should dry up.
Extract from the Sainte-Colombe map – 1677 (Source : BnF), extract from the Belin Jacques- Nicolas map- 1703-1772, extract from Cassini’s map– 1756-1789 (Source : Géoportail)
Only the Gattemare pond is present and is represented as an area of water on all maps which have been studied.
- Outlets
The Beautemps-Beaupré map (1832-1833), predates the construction of the tidal flood gates. It is interesting as we can see the old outlets of the marshes. These are, for the most part, located at the same sites as where the tidal flood gates were built.
Location of outlets prior to the construction of tidal flood gates (source : BnF)


